Apple is slick.
I'm a little bit of an Apple fanboy, despite not owning any Apple products. (Some of it comes from my love of the Fake Steve Jobs blog.) They have a clear idea of how to make a better consumer experience, and how to make money doing it.
So, I went to the Apple store the other day to purchase a gift. They have no sales counter -- instead, the clerks walk around with little terminals and scanners and close the purchase wherever you happen to be.
After swiping my credit card, the clerk asked me if he could e-mail me the receipt. Why not? Sounded convenient to me, and since everything else was so high-tech it seemed to fit.
But Apple is slick. Not only did I get the receipt -- I got a survey a day later. How did I like my visit? Do I own a Mac? How many iPods do I own? The survey wasn't as beautiful as you might expect from Apple -- it's actually done by CustomerSat -- but it was pretty good.
The experience was a reminder of something. Internal communications carries one distinct advantage -- the assumption of permission. By virtue of being on the same team, you can contact all of your customers. Businesses work hard to get permission to do the same with theirs. Apple's approach worked on me.
Thursday, February 14, 2008
Friday, February 08, 2008
Measuring engagement – a survey on career development
Like many big corporations, mine conducts "engagement surveys" to measure the love/hate quotient of employees. Overall engagement across the company is hard to impact. So, I looked more particularly at what our team could and could not control.
Questions about how people feel about senior leadership or corporate policies – out of scope. (I’m not in corporate, but rather a front-line business function.) However, some questions cover how direct managers operate, job satisfaction factors and career development. We can influence these things through policy changes, projects and communication.
I was asked to join the “engagement team” assembled to address the issues we could control. Based on the initial engagement survey results, our team identified two areas where the results were below average and within our control. One was career development and advancement. The engagement team brainstormed many ideas that might help in this area – mentoring programs, better integration of career development planning with our review process, and more. All great ideas, but naturally, I wanted more data. Before we start creating a bunch of programs, what’s the real need? Let’s do a survey.
Here’s what I wanted to know, for starters:
- How big is the audience for career development? What’s the “ambition level” of our employees? Do they want to become CEO, move up a notch, or simply be recognized for the work they do now?
- Has the company properly set expectations? How much responsibility do employees take for their own careers? (Note – this is a big communication opportunity.)
- What’s our baseline for success? How do they feel about their progress so far?
- What programs would get high participation? What’s the demand for a mentor program? Is that demand, high or low, based on experience? Do we need to improve career development planning as part of our established review process?
Working with the team, I developed the following questions. As usual, I tried to anticipate possible replies, to reduce or eliminate those pesky, hard-to-measure write-in comments.
Which of these statements match your career goals for the NEXT TWO YEARS? Click all that apply.
- I want to move up at least one level of management.
- I want to switch career paths and work in a new area.
- I want to complete the long-term goals I've taken on in my current role.
- I want to add some new skills to my current mix through study and/or a specific project assignment.
- I want to continue in my current role -- I'm picking up enough on the way to make it interesting.
- I want to begin managing others.
- I want to manage a larger team.
- I want to stop managing others.
- I want to manage a smaller team.
- I'm more interested in recognition for my contributions than career advancement.
- I want to begin, continue or complete a course of study for an advanced degree at an accredited school.
- Other (please specify)
Please rate your level of agreement with these statements. (Strongly agree; Agree; Not sure; Disagree; Strongly disagree)
- In 2007, my direct manager encouraged and supported my career advancement needs.
- The company has adequate next-level job opportunities that I could fill and which advance my career path.
- In 2007, I let the day-to-day needs of my job distract me and/or consume all of my time and attention, which kept me from focusing on career advancement.
- I have a pretty good idea of what I'll be doing in my career in three years.
- I don't feel discriminated against when it comes to advancement or development opportunities, based on some factor that does not measure my ability or qualifications. (Race, gender, country of origin, location, etc.)
- In 2007 I followed a formal career planning process that was been defined and tracked in performance management review sessions.
- The company offers training and experience opportunities that fit my career goals.
- I'm satisfied with the career progress I made in 2007.
- The company is too quick to go outside for talent instead of filling roles from within.
When it comes to career planning, development and advancement, how much responsibility belongs to the individual, and how much to the organization?
- 0 percent individual; 100 percent organization
- 10 percent individual; 90 percent organization
- 20 percent individual; 80 percent organization
- 30 percent individual; 70 percent organization
- 40 percent individual; 60 percent organization
- 50 percent individual; 50 percent organization
- 60 percent individual; 40 percent organization
- 70 percent individual; 30 percent organization
- 80 percent individual; 20 percent organization
- 90 percent individual; 10 percent organization
- 100 percent individual; 0 percent organization
- I've had experience being mentored at a different company or organization.
- I've had experience as a mentor at a different company or organization.
- I had a mentor earlier in my career here at (the company).
- I was a mentor earlier in my career here at (the company).
- I'm currently a mentor at (the company).
- I'm currently being mentored at (the company).
What's your opinion of mentor programs? (No experience/no opinion; Strongly agree; Agree; Disagree; Strongly disagree)
- Please provide additional comments if you wish
Are you interested in a mentoring program at (the company)?
- I'd like to be mentored.
- I would like to be a mentor.
- I'd like to do both.
- I'm not interested in the mentoring program.
Demographics
- To preserve anonymity – which we promised repeatedly – we limited demographic questions. We asked two. Are you based in
- How big is the audience for career development? Almost everyone has some kind of ambition. Only a handful were not thinking of moving on, advancing or getting an advanced degree – and some in that handful may have already done those things.
- Has the company properly set expectations? The distribution of answers in the "who's responsible" question was interesting. For the most part, it peaked around 70/30 - 80/20, with the individual taking the bulk of the responsibility. However, we had a big spike at 50/50. That tells me that we need to do more communication about the role of the company in development.
- What’s our baseline for success? The question, "I'm satisfied with the career progress I made in 2007," returned a bi-model distribution curve. It looks like a two-humped camel, with big peaks at "agree" and "disagree." I'll have to dive into the survey to see what we can learn about the differences between these two groups.
- What programs would get high participation? Lots of support for and interest in mentor programs. Good reviews and many volunteers – we should do it. Development as part of the review process was another one of those bi-model curves. More study needed, but looks like an opportunity, too.
A few final notes on this project. As usual, a little data goes a long way. This survey had only eight questions. Take away the two demographic questions and three about mentors, and you have just three, but it's all pretty overwhelming. I see two real advantages from the survey. First, it helps us spend precious resources on the right efforts. Second, it lets us communicate our efforts far more effectively. Every time we can say, "You told us this, so we're doing that," we gain an edge.
Friday, January 11, 2008
Happy New Year!
For the time being, I'm out of the internal communication racket. But there's a funny thing about that. I'm applying most of the same skills to my new role (consumer experience champion) that I used as an internal communicator.
Clear writing, illustration and video still matter. Strategic thinking matters. Effective measurement matters. Most importantly, putting yourself in the shoes of your audience and learning to advocate for both your audience and your client – that matters.
And as communicators, we tend to keep our eyes open for new communications opportunities. So we’re often more technical, more aware of the opportunities opening up on the Web and in mobile communications, than many in business. It’s natural, really, if we get pulled into other areas.
I don’t mind confessing that I spend a huge amount of time on the Internet while on the job. Some of it is directly connected to what I do – anyone would recognize it. But you and I know that it’s often the off-beat and unusual that sparks the new idea, or at least provides the zest to keep us going.
I’ve added a list of favorite Web links to this blog. Some spark thinking, some are terrific tools. I’m sure the list will grow and change over time, but here’s what I have today:
- Seth Godin's blog – Godin speaks for a new era of marketing, delivering fresh insights nearly every day. What are we but marketers, after all? Subscribe.
- The Consumerist – If you work for a business, the Consumerist will give you that exposure to what your customers are ticked off about. No waiting.
- Putting People First – An exhaustive and constantly-updated compendium of the latest developments in human/product interaction in just about every field you can think of.
- The Secret Diary of Steve Jobs – Consistently the funniest blog on the Web. And you may even learn something. (It just may not be true.) Hey, laughter matters.
- Ragan Communications site – I had a grudge against these guys, since they never invited me back after what seemed to be an extremely successful presentation at a convention a couple of years ago. But I have to admit that the revamped site and the Daily Update is interesting, dynamic and valuable. Hmmph.
- trendwatching.com – A commercial site that gives away great information – sign up for the quarterly report.
- We-make-money-not-art – We need some sites to find pure inspiration, right? Start here.
- boingboing - a directory of wonderful things – Among the most successful sites on the ‘Net, and it’s easy to see why. Wonderful indeed.
- The Cool Hunter – More neat stuff.
- Textually.org – Never mind the technology – keep up with how people are actually using it to communicate.
- Flickr.com – Need pictures of consumers using your products – or pictures of anything at all? Incredible resource.
- YouTube – Ditto above, for video.
- Simple Sample Size Calculator – How many surveys do I need to be able to defend my results? Here’s what I use.
- SurveyMonkey – The communicator's little friend. The paid version is a steal at $20/month but the free version is useful, too.
What sites did I miss, and what are they good for?
Wednesday, May 09, 2007
Naivety
Posting twice a year whether you want it or not...
I've grown up. I used to think I could drive change by presenting a compelling argument, backed by statistically defensible data. Ah, youth.
Recently I took part in a Six Sigma project designed to reduce product returns. We did, in fact, determine what was driving returns. And we designed and implemented a fix.
But we did not communicate the fix externally. Our PR and marketing partners wouldn't allow it. There is, as yet, scant appetite for transparent Web 2.0 communications. In my opinion, this is hurting us now, and will hurt a lot more in the future. I was also personally disappointed by this move. It drains one's enthusiasm.
In fact, I'd forgotten the first rule of business, taught me long ago by my older brother: "Good work constantly goes to waste."
More relevant to this column, it made me realize the dangers that emerge when your external communication team has different metrics than the internal team. I want to reduce returns and drive the business. PR wants to avoid the very appearance of evil. Not a good combination.
I swear the next post will be more positive.
Tuesday, December 05, 2006
With all due respect
I promised at the end of my last post to talk more about how surveys can provide more than just a measure of communication vehicle use. I think this topic also provides a nice link to this site's most recent comment. We'll get to that in a minute.
Understanding what messages are getting through to your audience, and through what vehicles, is powerful stuff. But it doesn't tell you much about the impact of your messages on that audience. I use another set of simple questions for that:
I found Dr. Clem’s presentation/the article about pencil safety:
- Interesting - it was entertaining and informative
- Credible - I believed what I heard
- Relevant - the topic is important
Respondents rate their level of agreement with these statements from “strongly agree” to “strongly disagree” or “I did not attend/read this.”
I like this approach because it gets at the impact of communication that is beyond the text of the message. People make many judgments based on their personal feelings about the messenger or the credibility of the vehicle. It also provides a window into how a team may be relating to a leader over time – is that leader gaining or losing credibility? If you ask this question of each presenter, article or vehicle, you’ll have a hierarchy to examine for key strengths and weaknesses. As the communications lead, you gain powerful information that will help you recommend actions to respond to changes in audience sentiment. Even the most intractable leader will have a hard time staying the course in the face of a low credibility ranking. (Pause for laughs.) You can more effectively coach leaders based on their communications strengths and challenges.
OK, let’s return to the comment I mentioned at the top, posted by Pat May. Here’s an excerpt:
With all due respect - I find it admirable that you do an effort to measure the effect of your channels. But is it enough? …We're hired to make a difference in our organizations. That difference in essence is to influence behavior. Behavior has an effect on business measurement like employee retention, customer retention, sales, new bizz etc. What I want to find out is how far can you go with pure metrics to connect input (communication) with output (organizational results that are measured on the 'bottom line').
This is the question communicators debate at IABC meetings and late at night at the bar at Ragan conferences. Are we worth a damn? I have, at least, 10 possible responses to this.
- To use currently-popular cliché, don’t make the perfect the enemy of the good. This blog was started to address the paralysis communicators often face because metrics are both difficult and not perfect. Use metrics to understand your basics first – don’t try to solve the world’s problems until day after tomorrow. Measure what you can and see if it helps you get better at your job.
- Communications aren’t going to go away without you. People are told – and learn – that they have to show up in the morning for work. That’s behavior. However, they have a lot of different feelings about how they are told. That’s where you – and your metrics – come in.
- If you really want to move the business, focus your communication abilities on the business. If you’re doing newsletters about the latest developments in your department, and who had a birthday, stop. Instead, find out how you can use your skills to help your department do its job better. Sounds harsh, but I’m sure we can all find ways to use our skills that are more important to the bottom line. I recently did a daily newsletter tracking online buzz about a new product so we could stay on top of issues. People are now beating down my door for the same treatment for their new products.
- I was half-kidding above. Those little birthday notices can be valuable in a million ways. They build community and team cohesion, and may draw people to the newsletter so they are exposed to other important messaging. However, I don't know if that's true – someone should measure it!
- If you’ve correctly identified a behavior, you should be able to track it. Do you conduct an annual employee survey? Go increase the response percentage – that’s behavior you can measure. What behavior do you want to change? As I've written before, if it's "work harder and have a better attitude" you have not identified the behavior you want. Driving behavior change may be another blog entry, but in the meantime, go explore the SimplerWork.com site for inspiration.
- If you do everything you can and can’t move the needle, don't blame the metrics.
- Many communications teams do not drive the business. I’d even say most. I've been on communications teams that were extensions of the CEO’s ego, for good or ill. Many have other duties, such as event planning, that require some non-communication skills. (And many communications skills, too.) Many provide a sense of family and community that is extremely comforting to a sizable segment of any large employee population but of no interest to others. I’m not aware of any – there may be a few – that are revenue sources. We are cost centers. A few – these happy few – provide significant cost avoidance advantages. Anything you do of significant value to the business will be pure gravy and will blow your bosses away. Be sure to measure it. If you have metrics, you will gain influence and credibility, so you will have more opportunities to improve the business.
- If your problem is that you don’t know what behaviors or messages to drive, welcome to the club. Neither does your boss. Make it your job to observe and learn what your colleagues respond to and what they don’t. Metrics can help. That’s why it’s good to ask those questions about interest, credibility and relevance. People are not machines. You can’t “input (communication)” and “output (organizational results)” or even behaviors in a one-to-one manner. In our field, communications provide directional information that should improve your chances of getting through to people, with the right message, in a way that doesn’t piss them off.
- It takes an amazingly small amount of data to prompt well-directed change for the better. I promise that if you ask 10 good questions you'll be overwhelmed with data that drives new ideas. And, you don't need the kind of statistical certitude in communications that you need in drug manufacturing or atomic power generation. You wouldn't be satisfied with being 80 percent sure that an aspirin won't kill you, but most leaders will act quickly on communications decisions that metrics have said have an 80 percent chance of success.
- This job is hard. To quote Tom Hanks as Jimmy Dugan in A League of Their Own, “It's supposed to be hard. If it wasn't hard, everyone would do it. The hard... is what makes it great.” If you really want to use metrics to understand how you’re driving the business, get after it. You may be the person to crack the code.
One more thing - start anywhere! For example, this blog entry, according to the Readability Statistics built into MS Word, is at an 8th grade reading level with a Reading Ease score of 62.5 and 6 percent passive sentences. My goals are to always be below Grade 11 (I love being at Grade 9 or below!) and above 50 in Reading Ease with passive sentences below 10 percent. I really use this tool, flawed as it is, because it keeps me honest. I can show, with metrics, that my audience should be able to read my writing. Not a bad metric for a communicator.
Can someone come over and help me off my soapbox?
Monday, October 23, 2006
Friday, October 06, 2006
Where can I find models of metrics to use for communications measurements? My company is big on metrics and measurements. As the new Communications Manager, I want to start off with benchmarks and measurement tools in place.
Hey, I got a comment! Thanks, Lawrence.
First, let me say that I have not written a book. I've made exactly one presentation at a conference. I'm not a paid measurement consultant, nor do I carefully follow the thinking of those who are. There may be great models out there, but I'm not familiar with them.
[Alright, let's do some research, by which I mean Google. I'll search "measuring internal communications." Hmmm. Melcrum will sell you a 210 page report. I'm sure it's excellent. Call me when you finish it -- next June is pretty good for me if you've finished by then.
For a change, let's NOT be snarky for a second. Check this string out. I've not read it yet but I will. It's a discussion on isixsigma.com titled "Examples of Measuring Internal Comms Messages." I bet you get some nuts-and-bolts information there.]
But you posted your question on my blog, so I'll give you my answer.
Models are not easy to come by because there isn't a lot of standardization in this area. I think that's OK, because your metrics should be tied to your goals. If you have standard goals, you will probably be able to find standard measurements.
However, I'll bet you have goals that are unique to your role, or to your view of what's important in internal communications. If you read some of my early posts, you'll know that I'm interested, mainly, in two key questions:
One: Did you get this message?
Two: If yes, through what vehicle?
This, for me, is the blocking and tackling part of metrics. Which vehicles are effective at delivering my messages? From that, I can figure out which vehicles to promote, which to deemphasize, which are used by different audiences and so on. (I like some demographic questions in the mix, too.)
I don't believe in asking people how they want to get their messages. Everyone will tell you that front line managers are the best way to communicate. For me, it would be Angelina Jolie whispering the corporate strategy into my ear, but that's not going to happen. Probably not. OK, not. And you are probably not going to be able to control what front line managers do, either. Get over it.
So, the approach above will help you understand your vehicles. The questions go like this:
* "Did you learn lately of a new employee health plan offering?"
* "If yes, how did you hear? Check all that apply."
Then you list your main vehicles, and some others, grouping where possible. For example:
* Company newsletter
* Company home page
* Department e-mail newsletter
* Directly from my manager
* Town Hall meeting
* External news source
* Peer
* Can't remember/don't know
You will think of more options, but try and group them if possible to avoid 20 options. More than 10 is a lot. Also, the external sources are important. (Stop me if you've heard this.) We asked "Have you heard about the increasing costs of health care?" a few years ago and more than 80 percent of respondents said yes, from external news sources. That took a big educational task off of our plate in advance of increasing health care costs. The networks had done it for us.
There is a separate question of the impact of the messages when they do get through. How do people feel about those messages? How do they feel about the leaders who delivered them? Next time, on Stand On A Box!
Wednesday, June 21, 2006
The best metrics
I've been continuing to conduct surveys to learn how our communication efforts are going over. (Typically, I've done a couple where I've not presented the results. Not too busy to do the research; just too busy to share. Hope that makes all you measurement procrastinators feel better.)
But I've had a couple of recent experiences that illustrate the power of experience and instinct. I want to share one in particular. It's a reminder that research only tells part of the story.
We hold our town hall meetings in a space designed for them. A stage with a podium, three screens for slides or video, a sound system and control booth -- the works. Because it was built to accommodate larger groups, our team tends to feel a bit sparse there. However, the town halls earn good marks on surveys, by and large.
Recently, however, we had a major organizational change. Our team and several others met in the "big room" for the key announcement. We then immediately held a meeting for our team only, crowding 50 people into a conference room. Some sat around the table while the rest stood leaning against the walls while a few peeked in the doorway.
This second meeting was a revelation. It was a dialogue, with terrific give-and-take between the team and leadership, much humor and a general feeling of camaraderie. The informality of the setting -- the lack of distance between "presenters" and "audience" -- freed everyone.
So my next group meeting for this smaller team will be in a big conference room, with chairs at the table and more around the walls, and people crowding in, and everyone -- boss, admin, staff -- at the same level. I'll let you know how it goes.
OK, back to surveys. I've been conducting a lot of them lately. A post-Town Hall survey; a survey to measure the popularity of a newsletter I launched to support a short-term project; and another as a kind of focus group to see if we can predict the interest in a contest we're designing for employees.
The first one is part of my job -- how did people react to the meeting, the presenters, the boss and the message delivered? I like these because after you've done a few you have a nice baseline and you can tell when interest and support is soft and when people are truly engaged.
The newsletter survey was pure self-promotion. Yes, I needed to do it as part of good, disciplined communication. But the newsletter was a smash hit and I already knew that from comments, subscription requests and other indicators. But now I have numbers, charts and quotes that will still be there when my performance review rolls around. I put together a PowerPoint deck and sent it off to my boss just to make sure that the good news arrived. Also, the newsletter had one detractor, someone who isn't a big fan of transparency and has a good sense of the power of tightly controlled information. (Which the newsletter took from him.) His responses to the survey stick out like a sore thumb. He gets to make his points, but the numbers are with me.
The third survey is a new type for me. I had to invent a bunch of new questions, redesign them when they didn't work and even toss a few out. It's always eye-opening to preview a survey you've just slaved over and realize how misleading, muddy, confusing and wrong headed it is. So if you don't already, test them yourself and send them to some friends who won't go telling everyone how lousy your drafts can be.
Tuesday, January 31, 2006
Tangent. Sort of.
This has something to do with measurement and everything to do with internal communications, so bear with me.
Between you and me, I'm against planted questions at Town Halls and other internal meetings. If people are not curious or comfortable enough to ask a question, we should know that and address it. (That's the measurement part.) I've never seen any evidence that planted questions "prime the pump" for additional questions. I have seen planted questions blow up when the setup was exposed. It can seriously undermine attendees' faith in what they are hearing and seeing.
One officer I worked for years ago would ask for questions at the end of his monthly video call with staff. If there were none or only one he would slowly say "I can't believe that there are no more questions. Just one question? No one has any questions about our company?" He didn't have to go on very long before questions started to come up. It's so much about a leader's perceived interest in actually addressing issues. Planted questions, I think, send the message that leadership is not interested in real questions, but in the perception of real questions. And let's face it -- the questions we dream up to plant just sound phoney. "What can I do to help drive additional market share?" "How do you think our values contributed to our good third-quarter results?" Ugh.
If leaders really want to answer questions they can be coached to elicit them.
OK, I'm climbing down off my soap box.
(I can't believe I haven't posted in two months...)
Wednesday, November 02, 2005
The Baseline
It’s taken a few more weeks than I hoped, but I’m ready to get my first baseline survey in the field at my new job. And, as usual, I’m learning in the process.
Let me explain a bit about what my role is, and then talk about some different survey question formats that you might like to consider. I also want to make a point about the importance of controlling the discussion in any communication effort.
I work at a large manufacturer of consumer electronics. Although the company is an established and successful consumer brand in its own right, much of the product is sold through retailers and other outlets. These customers have enormous influence. There is a growing sense within the firm that the needs of the end-user are not being fully considered. My job is to bring that end-user “consumer voice” to life inside the firm through communications.
I’ve spent several weeks trying to understand many things. What sources of consumer input does the firm use, and how? What are current attitudes about consumer needs? How are decisions made, and by whom? Are employees even aware of the end-user as a separate group of stakeholders? The answers, predictably, are over the map.
While I now feel I have a general sense of current attitudes and practices within the firm, I need to take the next step. I need to establish a baseline of attitudes and behaviors so I can measure and guide the impact of my communication efforts.
There is an extremely valuable, somewhat hidden opportunity here that I want to point out. Because there is no established way of thinking about this topic within my company, my survey represents a chance to really define the discussion going forward. How I frame the questions will influence how people think about the topic. Plus, I can prepare the soil for my communications campaign.
Now, I happen to think that a one-note symphony of a campaign would be a bad idea. I could go out and just pound the message – Consumers! Consumers! Consumers! – and get people’s attention. I don’t think it would help. I think we need to change the discussion so that people understand the complexity of our business. We need to balance many factors to be successful, like cost control, product quality and innovation. A great consumer experience needs to be one of those factors. I want a campaign that I can sustain and that contributes to the overall company effort.
With that in mind, here are a few of the survey questions I’m using. I think these will not only deliver valuable data, but also encourage the audience to think about the topic in a new way:
Please indicate your current level of awareness of these two distinct audiences – customers and consumers – in the course of your job:
- Strongly aware – I constantly consider the differences between these groups
- Aware – I consider the differences regularly
- Slightly aware – I occasionally consider these as separate groups
- Rarely aware – I almost never consider differences between the two groups
- Not aware – this is really the first time I’ve considered these as different groups
Customer and consumer needs are often, but not always, aligned. Both are important to our success.
- In your function, how do you currently feel the needs of customers and consumers are balanced? Please allocate a total of 10 points between the two groups, indicating how you think each group's interests are currently weighted. (For example, 7 points for customers, 3 for consumers; or 5 and 5.) The total must equal 10.
- Now, indicate how you personally feel the needs of customers and consumers should be balanced.
Please review the factors listed below, each important in developing and launching a new product or service. First, rank these factors in order of importance as you see them in practice today. Then, rank those same factors in the order you personally believe will best contribute to our success. You can use each ranking number only once. The top ranking is “1.”
- Engineering quality – the product works
- Cost of materials and development
- Competitor activities – to counter or anticipate moves by our competitors
- Consumer experience (packaging, user manuals, setting up the product, using it, support and service, repair, our Web site, etc.)
- Senior leadership decisions – reasons not clearly communicated to me
- Promised product release dates
- Customer requirements, including technical variations driven by regional standards
- Product design – how it looks and feels
There are other questions as well, but these best illustrate my point. The questions gather needed baseline data. The forced ranking question above will allow me, for example, to go to leadership and say “Here’s how employees currently rank our priorities in practice and as an ideal. Which ones do you think I should try to move, and in which direction?” At the same time, the questions force the audience to consider the complexity of what we’re trying to do. Once they acknowledge that these are not black-and-white issues, they’ve started to take responsibility for successful outcomes.
On a technical note, I tried to conduct this survey using existing survey tools within my company. However, internal resources could not accommodate forced ranking or constant sum questions like those I’ve shared here. At the risk of sounding like a shill, surveymonkey.com can provide these kinds of questions, and in my case, for the same price as the internal tool. This is my first use of the paid, expanded version of surveymonkey’s tool, and so far I’m impressed.
Wednesday, September 28, 2005
The Power of the Deck
I have surrendered to the ubiquity of the deck. Mostly.
I don't know where you work, but at the last few places I've been, information is not taken seriously unless it is crammed onto a PowerPoint slide. Never mind that a Word document would be better. Never mind even if it's an Excel spreadsheet with more cells than a Bin Ladin family reunion. (Ba-dum-dum-bum.) Just stick it in PowerPoint and you're golden.
(In fact, I've become so corrupted that I worry that I won't be taken seriously if I actually use PowerPoint correctly -- that is, all fonts must be at least 20 pts, etc. If there aren't a few eye-chart pages with 5 point type, I can't be doing anything really complicated.)
So when I finished the surveymonkey.com survey for my father-in-law, I naturally created a PowerPoint deck.
That's because I do think a PowerPoint deck is an important measurement communications tool. You will need to communicate the results of all the work you've been doing, none of which is resulting in a newsletter article, poster or letter to employees. A deck helps you organize your thinking and sell your analysis and conclusions so you can move forward with needed changes and improvements.
Here's what goes into my decks;
- An executive summary: I generally open with a page that explains the purpose of the survey or other measurement effort, plus some high-level details of how it was conducted. I include the statistical validity of the study, if possible, or at least the raw numbers of what was collected and how. Any team members who helped get a mention.
The rest of the executive summary contains brief conclusions drawn from the data. "Employees overwhelmingly prefer chocolate deserts. (2 top box = 82%)" "E-mails from the North American leader are opened by 78% of addressees, nearly double the rate of 40% for e-mails from the General Communication mailbox." - I usually place conclusions, recommendations and next steps at the end of the executive summary. This may include plans for changing communication activities, validation of current practices and plans for future measurement efforts. Occasionally, if I'm presenting it live and there is time and a good reason to walk people through the entire presentation, I may put them at the end.
- After the executive summary, I place a new section with a page devoted to each question, in order. I provide the actual question wording and results, generally with a graph that appropriately illustrates the results. If there's space, I may include selected write-in comments that further illuminate the issue.
For write-in questions, I look for common themes and summarize the number of mentions of specific topics, or provide a general sense of positive vs. negative comments, for example. This is more of a straight communication task -- read carefully and summarize responsibly. (There are Six Sigma methods for measuring and analyzing write-in data and as soon as I've done it myself I'll pass it on. Don't hold your breath...) - If I've done any additional work to break down comments by region or business unit or other demographic, I include a page on each of those efforts.
- After this section I add the appendices. One appendix includes all the raw numbers and the rationale for assigning statistical significance to the data -- what were my assumptions about the overall population being surveyed, such as size, location, make-up, etc.? How did I calculate the sample size, etc.?
The other appendix includes all the write-in comments verbatim. If this is a pretty good volume of text, I will use a small but readable font size of 10 to 12 points to avoid having 50 pages of comments. This is data that will obviously be read as a document rather than projected on a wall. I will also include the write-in comments in a separate word document. What's important to me is that I don't stand in the way of decision-makers getting to see the comments, though I will remove identifying names if necessary to preserve anonymity.
I find this whole practice very valuable. Once I get my data I love to play with it on a spreadsheet. Pretty soon the spreadsheet has 14 tabs and I can no longer find anything I've uncovered. The deck helps organize my thinking and let's me find results easily and clearly.
So, I did a short deck for my father-in-law, like I said. He was mightily impressed -- he thought a 14 page deck was huge! I haven't yet heard a report of his board meeting at his social club. I'm sure he killed.
By the way, he does not have PowerPoint. He's retired and can't work it anyway. Over the phone, I walked him through the process of downloading, installing and using the free PowerPoint viewer, which you can get here. You can't edit slides from this utility, but you can view them and print them.
I'm getting ready to put a survey in the field here at my new job, so I can get a baseline of where we are currently before I start introducing new communications tactics. More on that next time.
Wednesday, September 14, 2005
Charles is OK
Since I think at least some visitors to this site attended the Ragan conference in Las Vegas in June, you may be interested in this. Charles Pizzo, who writes the IABC and Ragan blogs, and who interviewed the Wonkette in Vegas, lives in New Orleans.
I had never met him before the convention. The organizers of the Ragan conference barely spoke two words to me. I'm sure it didn't help that I came in on Thursday, missing the opening night dinner for presenters, but I felt like an outsider. However, Charles and I struck up a conversation and he wrote some kind words about my presentation. When I decided to start this blog I wrote him an e-mail for some advice. About five minutes later, my phone rang, Charles calling in response. I've talked to him a few more times and he's always been friendly, helpful and insightful.
When Katrina hit I sent him an e-mail -- he didn't respond. His phone is busied-out. I was worried.
Yesterday he began posting on the Ragan blog. He's in Texas. He has been writing about his hurricane experience from his perspective as a professional communicator -- you can read his posts here.
So we can quit worrying about him.
Monday, September 12, 2005
Black Magic
It's been awhile since I've posted as I've started a new job. I've been busy wrapping things up at my old firm and I'm just getting started at my new one. Exciting times.
It's been awhile since I've posted as I've started a new job. I've been busy wrapping things up at my old firm and I'm just getting started at my new one. Exciting times.
Previous readers may note that I've deliberately avoided naming the company I work for on this blog, and I'm going to continue with that policy. I hope readers respect my desire to maintain that wall so I can write openly about measurement efforts without exposing company business.
One thing of interest -- this firm is committed to quality, and measurement is a big piece of that. That's the good news. What I find surprising is that even here, the need to measure the impact and results of communications has barely found a foothold. In a place brimming with Six Sigma and quality efforts, communications is largely a collection of strategic tactics with little measure of results. Green pastures for us metrics nuts.
Anyway, as I mentioned in an earlier post, my father-in-law belongs to a small club and I agreed to help him survey its members. It's not a country club but is a similar blend of sport and social activities. I used surveymonkey.com to create the survey and sent an introductory letter and URL link from his e-mail account so the members would not think it was spam from me.
He refers to the entire endeavor as "black magic" and is in awe of my pretty pedestrian talents with the computer. As usual, I learned a few things that I'll pass on here.
He has a slight tendency to ask questions I consider rhetorical. For example, a question like:
- When we schedule single night events for both Friday and Saturday evenings of the same weekend, both have often been undersubscribed. Members tend to subscribe to one or the other night, not both. We think there are advantages of having one fully subscribed event rather than two that are half-subscribed. Do you agree? Yes/No.
I'm not sure there's a lot of argument here, so my instinct is to eliminate the question. On a practical level, the question does make the survey longer, something I avoid like the plague. More to the point, surveymonkey.com only allows 10 questions in its free version, and in this case we were already over our limit.
The way I tackled it was to combine two questions. The next question asked if the combined event should be on Friday or Saturday. This is how the final question was posed:
- When we schedule single night events for both Friday and Saturday evenings of the same weekend, both have often been undersubscribed. Members tend to subscribe to one or the other night, not both. We think there are advantages of having one fully subscribed event rather than two that are half subscribed. If we scheduled single night events on only one night per weekend, which night would you prefer?
- I'd be more likely to attend on Friday nights.
- I'd be more likely to attend on Saturday nights.
- I'd be likely to attend on either night.
- I'm not likely to attend on either night.
- Other (please specify) text box provided
The respondent who doesn't agree that only one single night event should be scheduled per weekend can choose the "other" option to propose an alternative. It's still a bit wordy, but does the trick.
Similarly, several questions were variations on this:
- If we organized X event, would you be interested?
By combining these into a single question, we were able to get under the 10 question limit:
- We're considering several kinds of events for the upcoming season. Please check the ones that are of interest to you:
- X event
- Y event
- Z event
- Other (please specify) text box provided
In fact, we were down to nine questions, so I added a final question that asked responders to rate their overall satisfaction with their club membership. By always including that question in future surveys, the club can track whether it's moving in the right direction.
This is not just an exercise in being cheap. It's good self-discipline to make surveys short, both for the respondent and for you -- if you are inundated with data you will never finish playing with it and begin using it to make improvements.
I'll include directions for one simple thing that makes using these online surveys easier for the respondent. That is, creating a hyperlink so respondents can access the survey in a simple and non-threatening way. Being able to say: "Click here to take the survey" is much less threatening to the non-technical among us than "Click www.surveymonkey.com/Users/34815289/Surveys/5011304579/174B5D7A-BB16-4A63-AA8E-66ABFD3A.asp?U=503411304579 to take the survey."
This generally works for all Microsoft applications, such as Word or Outlook. It works in Yahoo e-mail. I suspect it works in nearly all applications, with some slight variation.
- Get the URL, also known as the Web address, of the site you want someone to go to. On surveymonkey.com, follow the directions when your survey is ready to send and click the selection for sending a link in e-mail. For other purposes, such as sending someone a link to a website, just copy the address from the Address window at the top of your browser. It usually begins with http://www. To copy the URL, highlight the text in the Address window or from your other source and go to Edit>Copy or press your CTRL button and the letter C at the same time.
- In your e-mail (or in Word if you're composing the e-mail there), highlight the word you want for a link. For example, if you say "Click here to access the survey" highlight the word "here."
- In Word or Outlook, go to the toolbar and select Insert>Hyperlink.
- Place your cursor in the little window and paste in the URL you copied. You can paste by pressing CTRL-P.
- In Yahoo mail and likely some other programs, look for the universal symbol of hyperlinks -- a little globe with some chain links over it. Click there for a hyperlink window, and paste in the URL.
- If it worked, the highlighted word will take on the look of a link. In most cases that means it will turn blue and be underlined, though the look changes depending on the program and settings.
- If you did all this in Word, you can copy and paste the text into your e-mail and the link will be pasted along with it.
- I always send the first draft of these e-mails to myself (and anyone else on the team) to be sure and test the link. You should too.
If this doesn't work, you may have an e-mail program that is set for "Plain Text." While some programs only allow plain text, many can be set to plain text, rich text, or HTML format. If you can't find a hyperlink option, look for a Format menu and see if you can change it from plain text to rich text or HTML. This works in Outlook, for example.
If you send a link to someone who has their e-mail set for plain text, the original URL will show up in their version and they will be able to click it to reach your survey or webpage.
This may be child's play for some of you, but here at Stand On A Box we know it's often hardest to learn the things that others take for granted.
And don't forget to enter your e-mail address on this site so you're alerted to new postings. Just scroll down on your right for the "Subscribe" window.
Thursday, August 18, 2005
Celebrity Endorsements
Last time I wrote about plans to check read receipts from e-mails sent from leaders of the firm. I was expecting a boost in opened e-mails from those leaders, compared to those sent from our "generic" mailbox. I was surprised by the size of the leap. Here's the data from an e-mail from the North American leader to all North American employees. (By the way, does everyone know that you can click on the tables to open up a large version?)
Last time I wrote about plans to check read receipts from e-mails sent from leaders of the firm. I was expecting a boost in opened e-mails from those leaders, compared to those sent from our "generic" mailbox. I was surprised by the size of the leap. Here's the data from an e-mail from the North American leader to all North American employees. (By the way, does everyone know that you can click on the tables to open up a large version?)
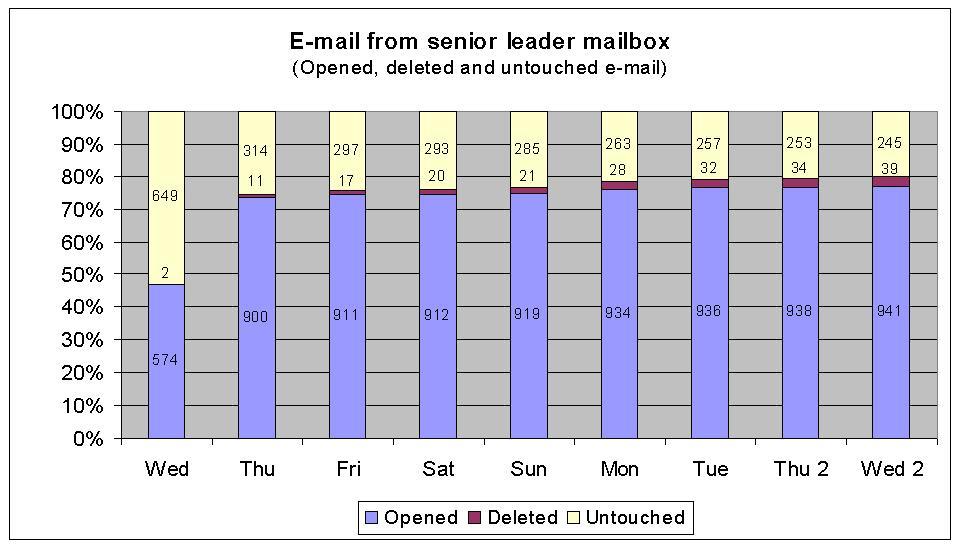
It pays to have the right messenger -- these numbers are nearly twice as good as the average. Here's a comparison between this message and all the other e-mails for which I've gathered read receipt data.
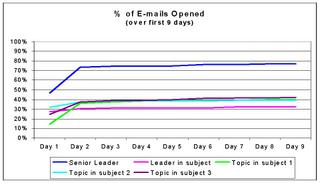
(Not sure why this is one won't open to a large version. Working on it.)
Now, there are a lot of differences among these messages aside from the messenger. They were sent to different audiences and the content was different. It's likely that the senior leader message was simply more important and interesting than the others.
However, I'd argue that the differences among the lower four messages reinforce the similarity of readership. The four lower messages all received essentially identical attention despite variations in audience and content. The North American leader message response is starkly different.
I'll do another check of messages from the leader mailbox when I have a chance. I hope to get a less compelling message to check -- something that is less interesting in itself, to see how people respond.
So, what good is this information? Here are a few thoughts:
- It helps manage expectations on message penetration.
- If you can isolate readership levels you can do a better job of judging what other factors are effective in your messages. Let's say I send two different messages, each asking employees to take a survey. I know from read receipts that 40 percent of employees read each of them, but one message drove 30 percent of employees to comply and the other just 20 percent. I can explore the message content, timing or other factors to see what drove the higher compliance.
- I was asked how many dial-in ports we might need if we asked all North American employees to attend a conference call with the North American leader. If I'd had only the earlier read receipt data I may have guessed that enough ports for half the employees would be plenty, since fewer than half of most e-mails are even opened. Because I had seen that more than 75 percent of North American employees opened the leader's most recent message, I increased my estimate.
- It sets a baseline and a goal for all messages. If I know I can reach 75 or 80 percent of employees given the right message and the right messenger, then I can be a more strategic messenger.
- The knowledge also creates a greater responsibility. Maybe I can reach all those people, but do I want to? Are all messages equal? Would my organization be more or less effective if I learned to get everyone to open and read every e-mail message sent? My role is also to protect my audience, so I think this data would drive better targeting of messages.
- At the very least, I now have a sense of what constitutes good and average message penetration -- and I didn't really know that before.
I've recently had HR give me a list of all employees by e-mail address, level, location and other data. I can now map my read receipts to this data to discover different response rates based on those factors. Are they more or less likely to read it in Europe? Do managers read more messages than vice presidents? As I've said before, a little data goes a long, long way, and you never know how handy it will be until you have it.
My next post will provide the remaining data from my post-conference session survey. Then, I'll be helping my father-in-law conduct a survey for a small social-and-sports club he belongs to, using surveymonkey.com. That will probably be worth a few laughs here at standonabox.
After that, I'm not sure -- I'm moving to a new job at a different firm in September. I expect it to have a large measurement component, which you will be able to read about here. Wish me luck!
Thursday, August 11, 2005
The Devil's in the details
I'm jumping back to read receipts this time, to provide some new information... and a warning.
I was waiting eagerly to get some read receipt data from two messages we were planning. One from our North America leader and one from our global leader. These would provide contrast to our other e-mail messages, which have been sent from our generic corporate mailbox.
Unfortunately, I failed to anticipate a simple change in plans. Someone else did me the favor of sending out the global leader message and neglected to request read receipts. Since those kinds of chances don't come along every day, it's disappointing.
It also shows the value of not trying to do these kinds of studies on your own -- form a team of interested parties and include everyone who might have a role to play in the process.
Anyway, the North America leader message receipts were very interesting. Next time...
Wednesday, August 03, 2005
Aw, shucks.
In which we take a break from read receipts...
This blog grew out of a Ragan Conference session on metrics in communications. In that session I extolled the beauty of www.surveymonkey.com, a great site for creating and analyzing surveys. I asked attendees if they would take a post-session survey and gathered their e-mail addresses for that purpose.
(Here I must again cop to the fact that I managed to lose all those e-mail addresses, except the ones given to me on business cards. Let me publically state for the record, again, that I'm a dope. If any of you are out there, my abject apologies.)
Anyway, I ended up with only nine respondents to my survey, which I conducted using www.surveymonkey.com. It is extremely easy to use -- I was able to put together a fairly sophisticated survey on my first visit. Basic features are free, and advanced features are an extremely reasonable $20/month. I've even used it for fun, silly surveys to amuse friends and family.
I promised to share the post-session results when they were in. I've hesitated because, frankly, they are embarassingly positive and I am -- deep, deep, deep, deep, deep, deep, deep, deep down -- the modest type. I guess it's my small-town upbringing.
But you may be interested in the survey questions, and I'd be interested in your thoughts on them. So in this post, I'll cover the demographic questions, and what my nine new best friends answered. (The numbers after the questions are the percent and raw number responding.) My next post will cover the questions and responses about the session itself.
In the demographic section (enticingly titled "About You") I asked these questions:
1. How would rate your experience with using metrics in your job before attending my session?
- No experience - I'd never done any real measurement (33.3% - 3)
- Beginner - I'd taken some small steps toward measuring my activities (55.6% - 5)
- Intermediate - I conduct regular measurement (0% - 0)
- Advanced - I've done considerable measurement and it's a regular and valuable part of my activities (11.1% - 1)
2. How long have you worked in communications?
- One to three years (33.3% - 3)
- Four to seven years (22.2% - 2)
- Eight to 10 years (11.1% - 1)
- More than 10 years (33.3% - 3)
3. What do you consider your core skills as a communicator? Please rate the following choices.
- Writing
1 No experience or proficiency 0% (0)
2 Beginner: I don't do it well and largely rely on others for this skill 0% (0)
3 Competent: I'm OK -- maybe not the best around 0% (0)
4 Proficient: Colleagues come to me for this skill 78% (7)
5 Expert: I'm among the best around 22% (2)
Response Average 4.22 - Communications strategy
1 No experience or proficiency 0% (0)
2 Beginner: I don't do it well and largely rely on others for this skill 0% (0)
3 Competent: I'm OK -- maybe not the best around 33% (3)
4 Proficient: Colleagues come to me for this skill 56% (5)
5 Expert: I'm among the best around 11% (1)
Response Average 3.78 - Project management/organization
1 No experience or proficiency 0% (0)
2 Beginner: I don't do it well and largely rely on others for this skill 0% (0)
3 Competent: I'm OK -- maybe not the best around 33% (3)
4 Proficient: Colleagues come to me for this skill 56% (5)
5 Expert: I'm among the best around 11% (1)
Response Average 3.78 - Relationship building
1 No experience or proficiency 0% (0)
2 Beginner: I don't do it well and largely rely on others for this skill 0% (0)
3 Competent: I'm OK -- maybe not the best around 44% (4)
4 Proficient: Colleagues come to me for this skill 56% (5)
5 Expert: I'm among the best around 0% (0)
Response Average 3.56 - Analytics, including metrics
1 No experience or proficiency 33% (3)
2 Beginner: I don't do it well and largely rely on others for this skill 33% (3)
3 Competent: I'm OK -- maybe not the best around 22% (2)
4 Proficient: Colleagues come to me for this skill 11% (1)
5 Expert: I'm among the best around 11% (1)
Response Average 2.11 - Business knowledge - general/finance
1 No experience or proficiency 0% (0)
2 Beginner: I don't do it well and largely rely on others for this skill 22% (2)
3 Competent: I'm OK -- maybe not the best around 56% (5)
4 Proficient: Colleagues come to me for this skill 11% (1)
5 Expert: I'm among the best around 11% (1)
Response Average 3.11 - Employee/internal communications
1 No experience or proficiency 0% (0)
2 Beginner: I don't do it well and largely rely on others for this skill 0% (0)
3 Competent: I'm OK -- maybe not the best around 22% (2)
4 Proficient: Colleagues come to me for this skill 67% (6)
5 Expert: I'm among the best around 11% (1)
Response Average 3.89 - Public relations
1 No experience or proficiency 11% (1)
2 Beginner: I don't do it well and largely rely on others for this skill 0% (0)
3 Competent: I'm OK -- maybe not the best around 33% (3)
4 Proficient: Colleagues come to me for this skill 44% (4)
5 Expert: I'm among the best around 11% (1)
Response Average 3.44 - Marketing/sales communications
1 No experience or proficiency 0% (0)
2 Beginner: I don't do it well and largely rely on others for this skill 25% (2)
3 Competent: I'm OK -- maybe not the best around 25% (2)
4 Proficient: Colleagues come to me for this skill 50% (4)
5 Expert: I'm among the best around 0% (0)
Response Average 3.25
Sounds like a pretty proficient group to me, bless 'em.
This is my list of communications proficiencies -- is it the right list? What's missing?
Next post -- the session questions and responses.
Wednesday, July 27, 2005
Reminder -- send a reminder?
I've finished comparing the read receipts from two e-mail announcements. The first went out two weeks in advance, letting people know that a new online tool was going to launch on June 27. The second went out on June 27, telling people it was up and ready to use. Here's the time chart for the second message -- it looks very much like the first one.
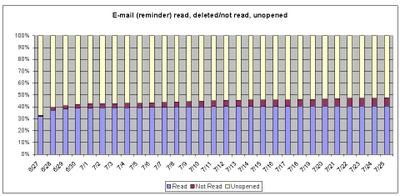
Again, 60 percent of the e-mails were never opened; that's the bad news. The good news is that people who open the e-mails open them fast. Nearly 80 percent were opened on the first day; more than 90 percent by the second day; and more than 95 percent by the third day. Leaving aside the question of whether they read or absorbed the message, they did open it.
Was the reminder worth it? I think so. Here's a breakdown that shows how many people opened each message, with the percent of the total audience (1910 addressees):
- Opened the first but not the second - 223 (12%)
- Opened the second but not the first - 240 (13%)
- Opened both - 551 (29%)
- Total opened - 1,014 (53%)
The reminder e-mail accounted for 24 percent of the total opened e-mails.
The data shows 5 percent of the recipients deleted both messages without opening them. It may be interesting to know if they are doing that soon after the mailing -- that would indicate they just aren't taking our calls. But it's just 5 percent and there are bigger fish to fry.
I've still not absorbed the full impact of this data -- half of these e-mails are never opened. There are a couple of things that appear evident:
- It looks like this particular corporate mailbox has a lousy brand. Readers don't expect value from its messages.
- E-mail is fast, cheap and easy but it's not reaching a big segment of the population. We need to find another powerful vehicle that will appeal to the e-mail averse.
The basic data here -- e-mail never opened -- is ridiculously easy to gather. Anyone else going to try it?
I'm going to do similar experiments on mail from senior leaders to see how that changes the rate of mail opened.
Tuesday, July 19, 2005
Did I already say that I'm not an Excel expert?
I'm working through some of the read receipt stuff, which I'll post soon. However, I got some help from someone who really knows Excel (thanks, John!) and I wanted to pass on a couple of things now.
Like before, I described grabbing the little black box on the lower right hand corner of a cell and pulling it down to copy a formula. Well, turns out you can just double-click that little black box and the formula automatically copies down, as long as there are filled cells in the column to the left.
Secondly, I'm using something called a vlookup in Excel to compare two lists. Since I don't want to write an Excel Users Manual here, I'm not sure how much of that process I'll be posting. When the time comes, let me know if you need the details and we'll figure something out.
One other thing John mentioned -- Outlook allows the e-mail receiver to turn off the read receipt function from their end. How common is that, and will it mess up the data? We don't know, so that's something else we'll have to look into.
No one said this stuff was easy. It's just better than communicating in the dark.
Monday, July 11, 2005
No (big) surprises.
I already sprang the big surprise on the read receipt data -- most e-mails in this mailing didn't even get opened. Here's a chart over time of the e-mail opened, deleted without being read, and those which have still not been opened or deleted.
I already sprang the big surprise on the read receipt data -- most e-mails in this mailing didn't even get opened. Here's a chart over time of the e-mail opened, deleted without being read, and those which have still not been opened or deleted.
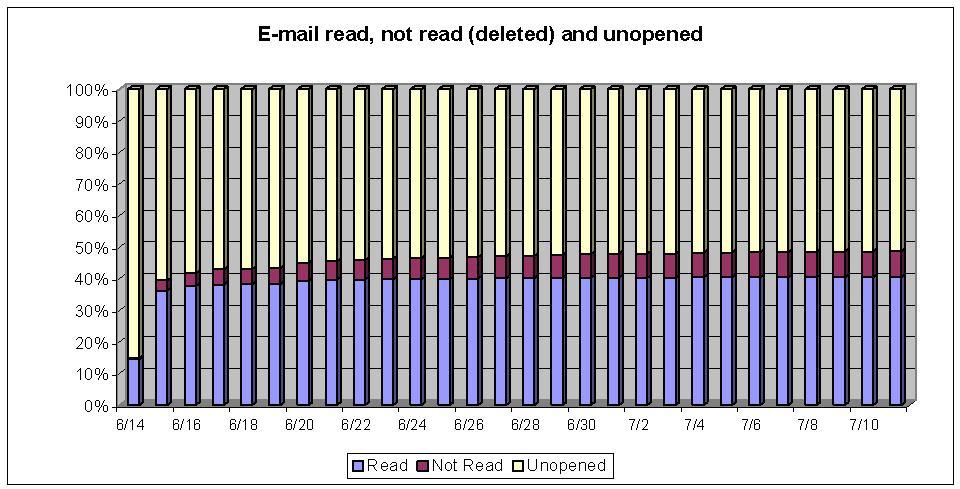
If you can't read it, the blue are opened e-mails, the Burgundy are e-mails deleted without being opened, and the yellow are still rotting in someone's e-mail box. You can see the launch day there on the far left. After two days most of the e-mails that were ever going to be opened were already opened.
The opened e-mails settled in at about 39 percent after eight or nine days and just stayed there. Deleted, unopened, grew a bit but there is certainly no mass exodus to clean out old e-mails. This particular e-mail was about a new on-line tool going live on June 27 -- just above the righthand corner of the legend there at the bottom.
We did a reminder e-mail the day the tool went live. I'll post that next time. Then I'm going to compare the two lists to see if the same people were e-mail openers, deleters and ignorers. I want to see if the day-of-launch e-mail reached new people or just reminded the same group that opened the first announcement.
Tuesday, July 05, 2005
Well, I feel kind of stupid here, continuing to post when no one has replied. I guess I need to be more controversial.
Or, it could be that the comments of all my readers have been secretly deleted by activist judges! I wonder...
OK, back to the great read receipt research. I want to share a couple of steps I skipped -- believe it or not -- that will come in handy as you're trying to clean up your data.
First of all, the lists of e-mail receipts and e-mail recipients may have some duplicates in them. If, like me, you use group mailing lists, or do multiple mailings, some people are going to get the message more than once. Those should be cleaned up before doing the final analysis to remove some of the error that is going to creep in. Here's how I do it.
- I have all the recipients, in Column A in MS Excel. In the previous post I indicated that there were 1927 names there. I'm going to filter out all the duplicate names.
- I click on the column header ("A") to select the column, then go to Date>Filter>Advanced Filter.
- Click "Copy to another location" -- otherwise the duplicate results are just hidden and can mess you up later.
- Create a new list range where you want the filtered records. I generally use column B on the same page, making sure it's empty, of course.
- Click "Unique records only" and then "OK." Column B will now have the de-duped list. In my case, I now show 1904 unique recipients instead of 1927.
With this many records, a few duplicates are not likely to change the results dramatically; with smaller samples it becomes more important. However, it's a great sniff test no matter how large your sample. If half your data disappears, you know something went wrong somewhere.
Sometimes your data will be hard to sort and analyze due to extra spaces in the records, especially at the front of a cell. Excel will not recognize that two entries are the same if one has a space or two before it and the other doesn't. For this problem, there's a great little function called Trim.
- Start like we did above, with all your data in column A.
- Make sure column B is empty, then select the first cell in column B that is next to your first entry in column A. (If A4 has your first entry, select B4.)
- Go to Insert>Function
- Type "trim" in the "Search for a function" field to find Trim. (If it doesn't come up, make sure "Or select a category" is set to "All.") Click "OK."
- In the new dialogue box, it is asking which cell you want to trim. Click in A4, then click OK.
- Now, B4 should be the same as A4, with any extra spaces removed except for one space between words.
- There are a lot of ways to extend this same formula to all the cells in column B so the whole list is trimmed. Here's what I do: I hold my cursor over cell B4, over the lower righthand corner of the cell where there is a black square inset in the black border. When my cursor turns from a white cross to a black cross, I click my left mouse button to grab it and just pull it straight down. It will fill all the cells as I go, until I release it.
In my next post, I'm going to look at the timing of the read receipts. Here's why:
- I want to know if the percentage of people who open the e-mails changes as time goes by. Do people keep old e-mail to read or just to eventually delete it? (At home, when my wife puts aging fruit in the refrigerator, I call it "the fruit hospice." Fruit goes into the refrigerator not to eventually be eaten, but to die out of sight so it can be decently thrown out. Is unopened e-mail more than a week old essentially in hospice?)
- What's my window for readership? At what point can I expect to have reached, say, 80 percent of those who will ever read it? That will tell me something about how far in advance of a deadline I should be communicating.
I'm now collecting read receipts for more e-mail communications so I have a larger data set on which to base my conclusions. Try to contain your excitement.
Subscribe to:
Posts (Atom)

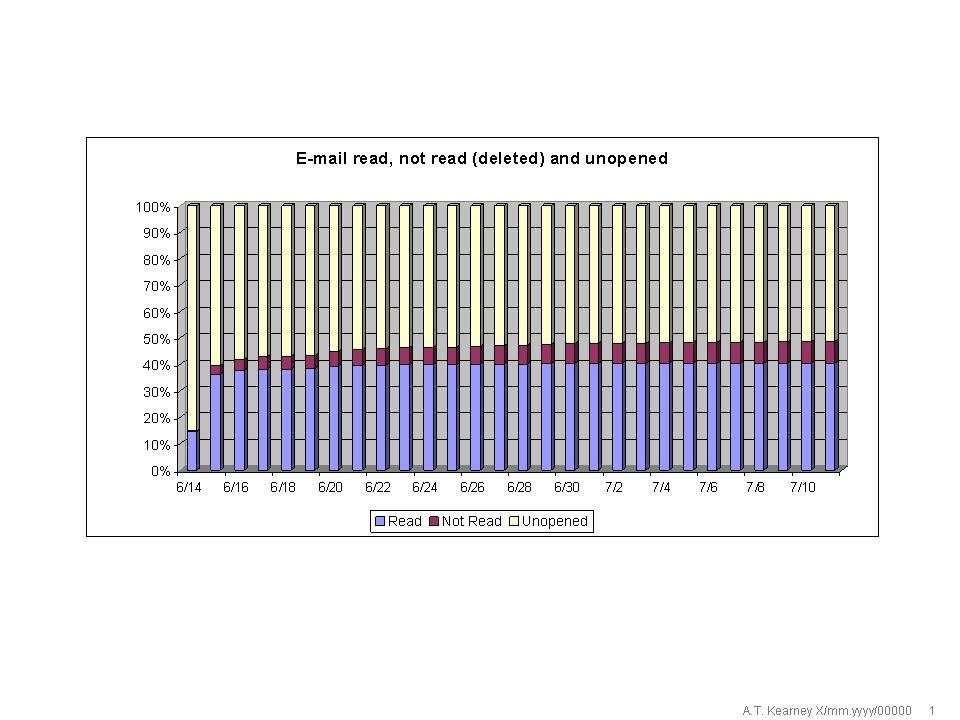