Thursday, August 18, 2005

Celebrity Endorsements

Last time I wrote about plans to check read receipts from e-mails sent from leaders of the firm. I was expecting a boost in opened e-mails from those leaders, compared to those sent from our "generic" mailbox. I was surprised by the size of the leap. Here's the data from an e-mail from the North American leader to all North American employees. (By the way, does everyone know that you can click on the tables to open up a large version?)
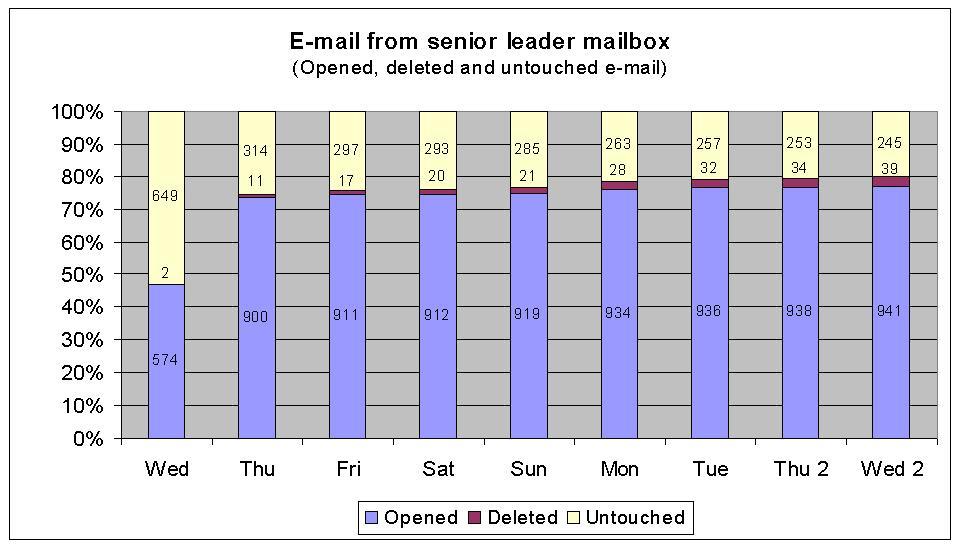


It pays to have the right messenger -- these numbers are nearly twice as good as the average. Here's a comparison between this message and all the other e-mails for which I've gathered read receipt data.
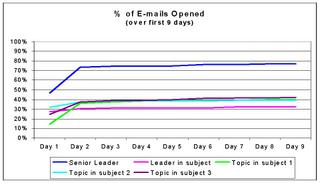

(Not sure why this is one won't open to a large version. Working on it.)

Now, there are a lot of differences among these messages aside from the messenger. They were sent to different audiences and the content was different. It's likely that the senior leader message was simply more important and interesting than the others.

However, I'd argue that the differences among the lower four messages reinforce the similarity of readership. The four lower messages all received essentially identical attention despite variations in audience and content. The North American leader message response is starkly different.

I'll do another check of messages from the leader mailbox when I have a chance. I hope to get a less compelling message to check -- something that is less interesting in itself, to see how people respond.

So, what good is this information? Here are a few thoughts:

  • It helps manage expectations on message penetration.
  • If you can isolate readership levels you can do a better job of judging what other factors are effective in your messages. Let's say I send two different messages, each asking employees to take a survey. I know from read receipts that 40 percent of employees read each of them, but one message drove 30 percent of employees to comply and the other just 20 percent. I can explore the message content, timing or other factors to see what drove the higher compliance.
  • I was asked how many dial-in ports we might need if we asked all North American employees to attend a conference call with the North American leader. If I'd had only the earlier read receipt data I may have guessed that enough ports for half the employees would be plenty, since fewer than half of most e-mails are even opened. Because I had seen that more than 75 percent of North American employees opened the leader's most recent message, I increased my estimate.
  • It sets a baseline and a goal for all messages. If I know I can reach 75 or 80 percent of employees given the right message and the right messenger, then I can be a more strategic messenger.
  • The knowledge also creates a greater responsibility. Maybe I can reach all those people, but do I want to? Are all messages equal? Would my organization be more or less effective if I learned to get everyone to open and read every e-mail message sent? My role is also to protect my audience, so I think this data would drive better targeting of messages.
  • At the very least, I now have a sense of what constitutes good and average message penetration -- and I didn't really know that before.

I've recently had HR give me a list of all employees by e-mail address, level, location and other data. I can now map my read receipts to this data to discover different response rates based on those factors. Are they more or less likely to read it in Europe? Do managers read more messages than vice presidents? As I've said before, a little data goes a long, long way, and you never know how handy it will be until you have it.

My next post will provide the remaining data from my post-conference session survey. Then, I'll be helping my father-in-law conduct a survey for a small social-and-sports club he belongs to, using surveymonkey.com. That will probably be worth a few laughs here at standonabox.

After that, I'm not sure -- I'm moving to a new job at a different firm in September. I expect it to have a large measurement component, which you will be able to read about here. Wish me luck!

Thursday, August 11, 2005

The Devil's in the details

I'm jumping back to read receipts this time, to provide some new information... and a warning.

I was waiting eagerly to get some read receipt data from two messages we were planning. One from our North America leader and one from our global leader. These would provide contrast to our other e-mail messages, which have been sent from our generic corporate mailbox.

Unfortunately, I failed to anticipate a simple change in plans. Someone else did me the favor of sending out the global leader message and neglected to request read receipts. Since those kinds of chances don't come along every day, it's disappointing.

It also shows the value of not trying to do these kinds of studies on your own -- form a team of interested parties and include everyone who might have a role to play in the process.

Anyway, the North America leader message receipts were very interesting. Next time...

Wednesday, August 03, 2005

Aw, shucks.

In which we take a break from read receipts...

This blog grew out of a Ragan Conference session on metrics in communications. In that session I extolled the beauty of www.surveymonkey.com, a great site for creating and analyzing surveys. I asked attendees if they would take a post-session survey and gathered their e-mail addresses for that purpose.

(Here I must again cop to the fact that I managed to lose all those e-mail addresses, except the ones given to me on business cards. Let me publically state for the record, again, that I'm a dope. If any of you are out there, my abject apologies.)

Anyway, I ended up with only nine respondents to my survey, which I conducted using www.surveymonkey.com. It is extremely easy to use -- I was able to put together a fairly sophisticated survey on my first visit. Basic features are free, and advanced features are an extremely reasonable $20/month. I've even used it for fun, silly surveys to amuse friends and family.

I promised to share the post-session results when they were in. I've hesitated because, frankly, they are embarassingly positive and I am -- deep, deep, deep, deep, deep, deep, deep, deep down -- the modest type. I guess it's my small-town upbringing.

But you may be interested in the survey questions, and I'd be interested in your thoughts on them. So in this post, I'll cover the demographic questions, and what my nine new best friends answered. (The numbers after the questions are the percent and raw number responding.) My next post will cover the questions and responses about the session itself.

In the demographic section (enticingly titled "About You") I asked these questions:

1. How would rate your experience with using metrics in your job before attending my session?
  • No experience - I'd never done any real measurement (33.3% - 3)
  • Beginner - I'd taken some small steps toward measuring my activities (55.6% - 5)
  • Intermediate - I conduct regular measurement (0% - 0)
  • Advanced - I've done considerable measurement and it's a regular and valuable part of my activities (11.1% - 1)

2. How long have you worked in communications?

  • One to three years (33.3% - 3)
  • Four to seven years (22.2% - 2)
  • Eight to 10 years (11.1% - 1)
  • More than 10 years (33.3% - 3)

3. What do you consider your core skills as a communicator? Please rate the following choices.

  • Writing
    1 No experience or proficiency 0% (0)
    2 Beginner: I don't do it well and largely rely on others for this skill 0% (0)
    3 Competent: I'm OK -- maybe not the best around 0% (0)
    4 Proficient: Colleagues come to me for this skill 78% (7)
    5 Expert: I'm among the best around 22% (2)
    Response Average 4.22
  • Communications strategy
    1 No experience or proficiency 0% (0)
    2 Beginner: I don't do it well and largely rely on others for this skill 0% (0)
    3 Competent: I'm OK -- maybe not the best around 33% (3)
    4 Proficient: Colleagues come to me for this skill 56% (5)
    5 Expert: I'm among the best around 11% (1)
    Response Average 3.78
  • Project management/organization
    1 No experience or proficiency 0% (0)
    2 Beginner: I don't do it well and largely rely on others for this skill 0% (0)
    3 Competent: I'm OK -- maybe not the best around 33% (3)
    4 Proficient: Colleagues come to me for this skill 56% (5)
    5 Expert: I'm among the best around 11% (1)
    Response Average 3.78
  • Relationship building
    1 No experience or proficiency 0% (0)
    2 Beginner: I don't do it well and largely rely on others for this skill 0% (0)
    3 Competent: I'm OK -- maybe not the best around 44% (4)
    4 Proficient: Colleagues come to me for this skill 56% (5)
    5 Expert: I'm among the best around 0% (0)
    Response Average 3.56
  • Analytics, including metrics
    1 No experience or proficiency 33% (3)
    2 Beginner: I don't do it well and largely rely on others for this skill 33% (3)
    3 Competent: I'm OK -- maybe not the best around 22% (2)
    4 Proficient: Colleagues come to me for this skill 11% (1)
    5 Expert: I'm among the best around 11% (1)
    Response Average 2.11
  • Business knowledge - general/finance
    1 No experience or proficiency 0% (0)
    2 Beginner: I don't do it well and largely rely on others for this skill 22% (2)
    3 Competent: I'm OK -- maybe not the best around 56% (5)
    4 Proficient: Colleagues come to me for this skill 11% (1)
    5 Expert: I'm among the best around 11% (1)
    Response Average 3.11
  • Employee/internal communications
    1 No experience or proficiency 0% (0)
    2 Beginner: I don't do it well and largely rely on others for this skill 0% (0)
    3 Competent: I'm OK -- maybe not the best around 22% (2)
    4 Proficient: Colleagues come to me for this skill 67% (6)
    5 Expert: I'm among the best around 11% (1)
    Response Average 3.89
  • Public relations
    1 No experience or proficiency 11% (1)
    2 Beginner: I don't do it well and largely rely on others for this skill 0% (0)
    3 Competent: I'm OK -- maybe not the best around 33% (3)
    4 Proficient: Colleagues come to me for this skill 44% (4)
    5 Expert: I'm among the best around 11% (1)
    Response Average 3.44
  • Marketing/sales communications
    1 No experience or proficiency 0% (0)
    2 Beginner: I don't do it well and largely rely on others for this skill 25% (2)
    3 Competent: I'm OK -- maybe not the best around 25% (2)
    4 Proficient: Colleagues come to me for this skill 50% (4)
    5 Expert: I'm among the best around 0% (0)
    Response Average 3.25

Sounds like a pretty proficient group to me, bless 'em.

This is my list of communications proficiencies -- is it the right list? What's missing?

Next post -- the session questions and responses.

Wednesday, July 27, 2005

Reminder -- send a reminder?

I've finished comparing the read receipts from two e-mail announcements. The first went out two weeks in advance, letting people know that a new online tool was going to launch on June 27. The second went out on June 27, telling people it was up and ready to use. Here's the time chart for the second message -- it looks very much like the first one.


Again, 60 percent of the e-mails were never opened; that's the bad news. The good news is that people who open the e-mails open them fast. Nearly 80 percent were opened on the first day; more than 90 percent by the second day; and more than 95 percent by the third day. Leaving aside the question of whether they read or absorbed the message, they did open it.

Was the reminder worth it? I think so. Here's a breakdown that shows how many people opened each message, with the percent of the total audience (1910 addressees):
  • Opened the first but not the second - 223 (12%)
  • Opened the second but not the first - 240 (13%)
  • Opened both - 551 (29%)
  • Total opened - 1,014 (53%)

The reminder e-mail accounted for 24 percent of the total opened e-mails.

The data shows 5 percent of the recipients deleted both messages without opening them. It may be interesting to know if they are doing that soon after the mailing -- that would indicate they just aren't taking our calls. But it's just 5 percent and there are bigger fish to fry.

I've still not absorbed the full impact of this data -- half of these e-mails are never opened. There are a couple of things that appear evident:

  • It looks like this particular corporate mailbox has a lousy brand. Readers don't expect value from its messages.
  • E-mail is fast, cheap and easy but it's not reaching a big segment of the population. We need to find another powerful vehicle that will appeal to the e-mail averse.

The basic data here -- e-mail never opened -- is ridiculously easy to gather. Anyone else going to try it?

I'm going to do similar experiments on mail from senior leaders to see how that changes the rate of mail opened.

Tuesday, July 19, 2005

Did I already say that I'm not an Excel expert?

I'm working through some of the read receipt stuff, which I'll post soon. However, I got some help from someone who really knows Excel (thanks, John!) and I wanted to pass on a couple of things now.

Like before, I described grabbing the little black box on the lower right hand corner of a cell and pulling it down to copy a formula. Well, turns out you can just double-click that little black box and the formula automatically copies down, as long as there are filled cells in the column to the left.

Secondly, I'm using something called a vlookup in Excel to compare two lists. Since I don't want to write an Excel Users Manual here, I'm not sure how much of that process I'll be posting. When the time comes, let me know if you need the details and we'll figure something out.

One other thing John mentioned -- Outlook allows the e-mail receiver to turn off the read receipt function from their end. How common is that, and will it mess up the data? We don't know, so that's something else we'll have to look into.

No one said this stuff was easy. It's just better than communicating in the dark.

Monday, July 11, 2005

No (big) surprises.

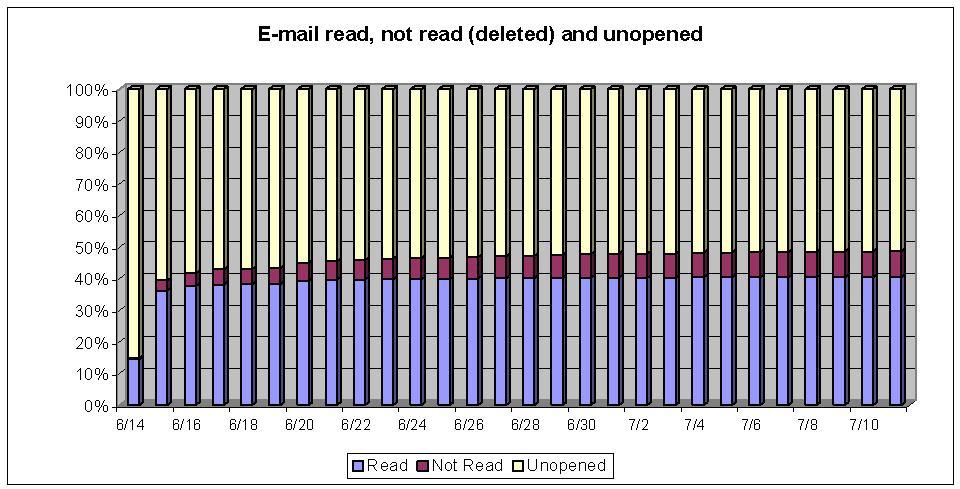
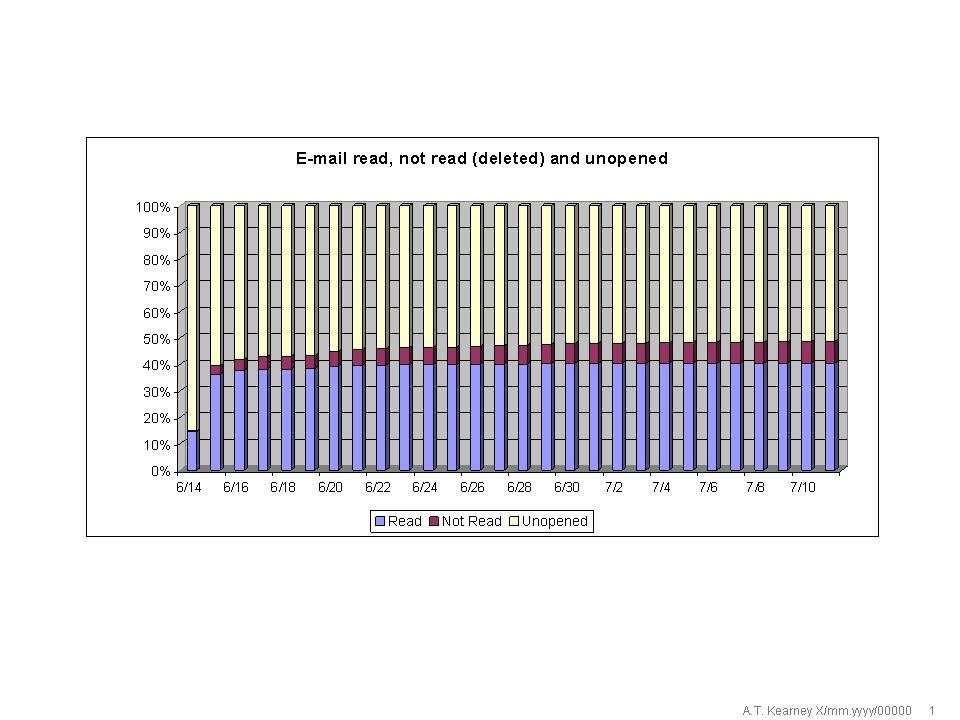
I already sprang the big surprise on the read receipt data -- most e-mails in this mailing didn't even get opened. Here's a chart over time of the e-mail opened, deleted without being read, and those which have still not been opened or deleted.


If you can't read it, the blue are opened e-mails, the Burgundy are e-mails deleted without being opened, and the yellow are still rotting in someone's e-mail box. You can see the launch day there on the far left. After two days most of the e-mails that were ever going to be opened were already opened.

The opened e-mails settled in at about 39 percent after eight or nine days and just stayed there. Deleted, unopened, grew a bit but there is certainly no mass exodus to clean out old e-mails. This particular e-mail was about a new on-line tool going live on June 27 -- just above the righthand corner of the legend there at the bottom.

We did a reminder e-mail the day the tool went live. I'll post that next time. Then I'm going to compare the two lists to see if the same people were e-mail openers, deleters and ignorers. I want to see if the day-of-launch e-mail reached new people or just reminded the same group that opened the first announcement.

Tuesday, July 05, 2005

Well, I feel kind of stupid here, continuing to post when no one has replied. I guess I need to be more controversial.

Or, it could be that the comments of all my readers have been secretly deleted by activist judges! I wonder...

OK, back to the great read receipt research. I want to share a couple of steps I skipped -- believe it or not -- that will come in handy as you're trying to clean up your data.

First of all, the lists of e-mail receipts and e-mail recipients may have some duplicates in them. If, like me, you use group mailing lists, or do multiple mailings, some people are going to get the message more than once. Those should be cleaned up before doing the final analysis to remove some of the error that is going to creep in. Here's how I do it.
  1. I have all the recipients, in Column A in MS Excel. In the previous post I indicated that there were 1927 names there. I'm going to filter out all the duplicate names.
  2. I click on the column header ("A") to select the column, then go to Date>Filter>Advanced Filter.
  3. Click "Copy to another location" -- otherwise the duplicate results are just hidden and can mess you up later.
  4. Create a new list range where you want the filtered records. I generally use column B on the same page, making sure it's empty, of course.
  5. Click "Unique records only" and then "OK." Column B will now have the de-duped list. In my case, I now show 1904 unique recipients instead of 1927.

With this many records, a few duplicates are not likely to change the results dramatically; with smaller samples it becomes more important. However, it's a great sniff test no matter how large your sample. If half your data disappears, you know something went wrong somewhere.

Sometimes your data will be hard to sort and analyze due to extra spaces in the records, especially at the front of a cell. Excel will not recognize that two entries are the same if one has a space or two before it and the other doesn't. For this problem, there's a great little function called Trim.

  1. Start like we did above, with all your data in column A.
  2. Make sure column B is empty, then select the first cell in column B that is next to your first entry in column A. (If A4 has your first entry, select B4.)
  3. Go to Insert>Function
  4. Type "trim" in the "Search for a function" field to find Trim. (If it doesn't come up, make sure "Or select a category" is set to "All.") Click "OK."
  5. In the new dialogue box, it is asking which cell you want to trim. Click in A4, then click OK.
  6. Now, B4 should be the same as A4, with any extra spaces removed except for one space between words.
  7. There are a lot of ways to extend this same formula to all the cells in column B so the whole list is trimmed. Here's what I do: I hold my cursor over cell B4, over the lower righthand corner of the cell where there is a black square inset in the black border. When my cursor turns from a white cross to a black cross, I click my left mouse button to grab it and just pull it straight down. It will fill all the cells as I go, until I release it.

In my next post, I'm going to look at the timing of the read receipts. Here's why:

  • I want to know if the percentage of people who open the e-mails changes as time goes by. Do people keep old e-mail to read or just to eventually delete it? (At home, when my wife puts aging fruit in the refrigerator, I call it "the fruit hospice." Fruit goes into the refrigerator not to eventually be eaten, but to die out of sight so it can be decently thrown out. Is unopened e-mail more than a week old essentially in hospice?)
  • What's my window for readership? At what point can I expect to have reached, say, 80 percent of those who will ever read it? That will tell me something about how far in advance of a deadline I should be communicating.

I'm now collecting read receipts for more e-mail communications so I have a larger data set on which to base my conclusions. Try to contain your excitement.

Wednesday, June 29, 2005

I was writing about using read receipts to measure the effectiveness of e-mail messages. The first step was getting the information into Excel, a task that looked easy, and then got a lot tougher. Here's why.

These response receipts come as an e-mail in three format flavors:

  1. Employee name / Read: Message Title /Date-Time Received / Size
  2. Employee name / Not Read: Message Title Date-Time Received / Size
  3. System Administrator / Message Delivered / Date-Time Received / Size
First, I just tried the obvious easy way -- I copied all the messages in the folder where I'd stored them and tried pasting them into an Excel spreadsheet. It worked! The e-mail headers pasted neatly into columns with the same labels as they have in Outlook: From / Subject / Received / Size.

But.

I tried again later and it didn't work. All the message title information was in a single cell and there were no delimiters that could be used to separate the text to columns. I killed myself trying, finally figuring out how to select and export the data as an Excel file (In Outlook: File>Import and Export...>Export to file>Next>Microsoft Excel>Next>Select Folder to Export From>Save Exported File As (Browse)>Next>Finish).

But.

I figured it out today. The key is to sort the e-mails by Subject in Outlook. If you do, you can simply cut and paste them into Excel. I then did a find-and-replace to cut out the title so I just had the names, whether it was read or deleted without being read, and when that happened.

OK, what does the data reveal?

Out of 905 read/not read replies, 85 percent had been opened. Just 15 percent were deleted without being read. Sounds pretty good, though we know what we don't know -- did the people who opened the message read and/or absorb the message.

But.

What about those other responses -- the third "flavor" above. Turns out those are important. They show who actually received the message. You may also have the same information from your distribution list. Anyway, turns out my message went out to 1928 addresses. Now the numbers are not so hot -- 40 percent opened it, 7 percent deleted it without opening it, and a whopping 53 percent have yet to touch it.

Next time, an even deeper dive.

Friday, June 24, 2005

Hello and welcome. This is a new blog where communicators can discuss methods for measuring the impact of their work. While my experience is in internal corporate communications, I hope some of the measuring methods can be used for all kinds of purposes.

I intend to get geeky here. What I hear from communicators is that they don't get the nuts-and-bolts of how to undertake measurement from most sources. They get theory. I'll do my best to give step-by-step descriptions of how this stuff works.

Anyway -- latest measurement thought.

I recently sent out a broadcast e-mail to a subset of our employee population. The e-mail mistakenly had both the the read- and delivery-receipt options selected. Luckily, the message went out from a group mailbox so I didn't get all the responses in my own Outlook e-mail. I saved them, though, and now I have 913 bits of data, with more coming in every day. I'm trying to see if they provide a bit of a view into what happens when we send this stuff out.

Here are a few of the things I might learn from this information:

  • How many people open these messages vs. just deleting them without reading them?
  • What is the timing of this activity? How long do they wait to take either action?

This is a start. Through a follow-up survey, I could find out if the people who opened the e-mail retained any of the message. I could find out why so many people never opened it, and if they received the same message through some other channel. Is there a better way to reach them? Are there regional differences in how they treat the data? Can I improve my "opened" numbers with clever subject lines or other tactics?

This all seems worth doing -- we rely on e-mail to an amazing degree. By looking at the first two bullets I can size the problem and decide if it's worth pursuing. I don't need any additional data to tackle those two, but I do have to figure out how to get these bounce-back responses into a spreadsheet so I can easily analyze them. I have to make the machine eat the work.

More on that process -- the nuts and bolts -- in my next post. I'd like to know what e-mail programs you use, so we can determine if this will work for systems that don't use Outlook.